The goal of benchmark reports is to find big-picture trends that show not only where a sector has been, but also where it’s going.
Looking back is always easier than forecasting projections, and that’s especially true during an unprecedented global pandemic. In our 2020 Animal Welfare Benchmark Report, the big story for 2019 was a shift in strategy that focused on targeting donors.
Unlike food banks, where disasters can cause dramatic fluctuations in giving, donations to animal welfare organizations are relatively stable year over year (YOY). But there is a trend we’ve seen playing out in recent years.
As wealth inequality continues to grow nationwide, we see this reflected in fundraising. For years, the donor pyramid has been narrowing across the nonprofit world.
With fewer donors giving bigger gifts to organizations, RKD adapted our strategic targeting for animal welfare organizations to lean into this trend. In essence, the aim was to focus on true mission-based donors who would be more committed over the long term.
Thus, when we look at direct-response gifts under $10,000, RKD’s animal welfare organizations average a 6.5% increase YOY. We also saw lifts in number of gifts, average gift size and retention, while the decreases we saw in new donors and active donors were expected.
This YOY animal welfare revenue exceeds the nonprofit industry averages in the Fundraising Effectiveness Project’s 2019 report (1.4% decrease in revenue) and Blackbaud Institute’s 2019 Charitable Giving Report (1.0% increase in revenue).
Our clients often ask questions like, “How does our organization’s performance look when compared to other animal welfare organizations?” and “How does charitable giving to animal welfare groups look year-over-year?” RKD Group’s annual Animal Welfare Benchmark Report was developed to help provide answers.
The 2020 Animal Welfare Benchmark Report contains full-file data from 76 RKD animal welfare clients across the United States from Jan. 1, 2019 to Dec. 31, 2019. The data includes overall program metrics like total revenue, active donors, new donors, retention rate, average gift size and number of gifts.
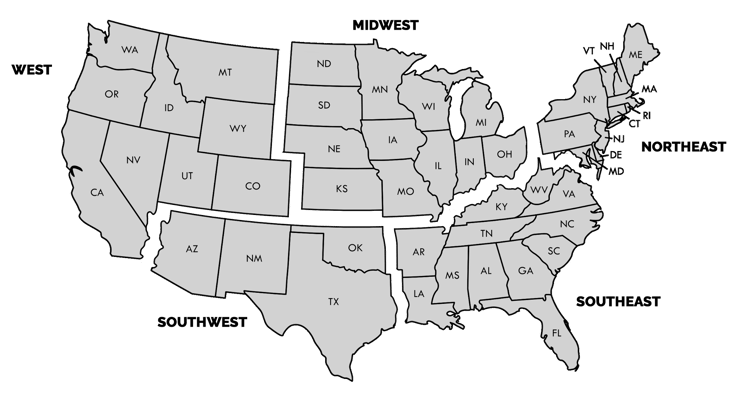
We’ve broken this data out into five regions across the U.S.: West, Southwest, Midwest, Northeast and Southeast. We’ve also categorized the data by organization size (determined by 0-12-month active donor file): Large, Mid, Small and Emerging.

Animal welfare organizations saw no increase (0%) in total year-over-year (YOY) giving for 2019. When we take out revenue from donors whose highest previous contribution (HPC) is over $10,000, giving increased by 6.5%.
But looking at data in a one-year window doesn’t tell the full story. For example, we know 2018 proved to be a difficult year for many nonprofits, especially for year-end giving.
So, let’s zoom out a bit for a wider view.
Across a five-year span, total revenue for animal welfare organizations has gone up 28.4% since 2015. In the same time frame, revenue under $10,000 has increased 25.1%.
The total number of active donors dropped 1.3% YOY as a result of a new strategic approach. But, when compared to 2015, animal welfare donors have been quite steady, dropping by only 0.2%.
Retention has held steady between 48% and 50% since 2015, with the exception of a drop to 46% in 2018. Retention is up 4.5% in FY19, and we expect that trend to continue in the coming years.
Clearly, retention is not the reason for the decline in active donors. We can turn to acquisition to understand more. The number of new and reactivated animal welfare donors declined by 0.8% YOY, and acquisition is down 1.7% overall from 2015.
How are animal welfare organizations bringing in more revenue with fewer donors? Bigger average gifts and more frequent gifts.
The average gift size for animal welfare groups increased 4.9% YOY and is up 18.2% since 2015. Gift frequency also went up 2.8% YOY and is up 5.9% since 2015.
These five-year trends in revenue and donors reflect what we mentioned in the introduction: broad industry trends of fewer donors who are giving more.
The FEP report showed an 18.3% increase in revenue and a 1.4% drop in donors from 2015 to 2019. The CCS Philanthropic Landscape 2019 report shows a 3.6% revenue increase from 2014 to 2018, while noting widespread declines in the number of households giving since 2000.
Large animal welfare organizations had a mixed bag in 2019. These 10 animal welfare groups have 10,000-plus donors.
Mid-sized animal welfare organizations had a challenging 2019 that resulted in even revenue YOY. These 9 animal welfare groups have 5,000-9,999 donors.
Small animal welfare organizations had a terrific 2019, with gains across the board in all metrics. These 23 animal welfare groups have 2,000-4,999 donors.
Finally, emerging animal welfare organizations saw three metrics increase and three metric decrease. These 34 animal welfare groups have under 2,000 donors (noting that small changes can have big effects among organizations at this size).
Animal welfare organizations in the West region had a mixed bag in 2019, but still finished with an increase in revenue. (Note: The West typically lags behind nationwide giving trends, so the struggles of 2018 spilled into 2019 for these organizations.) These 18 animal welfare groups are located throughout 9 states in the West.
Unlike their neighbors, animal welfare organizations in the Southwest region had a very strong 2019, with gains in all metrics. These 5 animal welfare groups are located throughout 4 states in the Southwest.
Moving to the middle of the U.S., animal welfare organizations in the Midwest region also had a strong 2019. These 13 animal welfare groups are located throughout 12 states in the Midwest.
Continuing the trend, animal welfare organizations in the Northeast region saw gains in all 6 metrics. These 18 animal welfare groups are located throughout 11 states in the Northeast.
Animal welfare organizations in the Southeast region mostly saw gains in 2019, while total gifts and active donors declined slightly. These 22 animal welfare groups are located throughout 12 states in the Southeast.